You can optimize a warehouse. Or you can ask why you have one.
That question separates companies that shave a few points off their carrying costs from companies that remove the line item entirely. Both approaches have their place. But only one changes your cost structure.
Here’s the reality most operations leaders already know but haven’t quantified: the average inventory carrying cost in North America sits at 25% of total inventory value per year. For a company holding $3 million in parts and materials, that’s $975,000 annually. Not in production costs. Not in raw materials. In the privilege of letting stock sit on shelves.
That’s dead capital. Money that could fund growth, hire talent, upgrade equipment, or reduce debt. Instead, it’s paying for warehouse space, insurance, obsolescence, and the silent erosion of opportunity cost.
The good news: you have options. Seven of them, ranging from basic optimization to a complete structural shift in how you think about inventory.
Methods 1 through 6 are proven cost reduction tactics. They typically save 10-30% on carrying costs. Method 7 is different. It doesn’t reduce carrying costs. It eliminates them entirely for applicable SKUs.
Method 1: ABC Analysis (Categorize by Value and Velocity)
Not all inventory deserves the same attention. ABC analysis sorts your stock into three tiers based on impact:
- A items: Top 10-20% of SKUs driving 70-80% of total inventory value
- B items: Middle 20-30% of SKUs representing 15-20% of value
- C items: Bottom 50-60% of SKUs accounting for 5-10% of value
The math is simple but the insight is powerful. Most companies apply the same reorder logic, safety stock rules, and review cycles to everything. Your $0.50 washers get the same management overhead as your $5,000 assemblies.
How to implement it:
- Pull 12 months of inventory data from your ERP.
- Rank every SKU by annual consumption value (unit cost multiplied by annual demand).
- Assign A, B, and C categories using the thresholds above.
- Apply differentiated policies. A items get weekly review cycles and tight safety stock. C items get quarterly reviews and aggressive destocking.
Expected savings: 5-15% reduction in total carrying costs. The gains come from reallocating management attention and tightening controls on high-value items where even small improvements move the needle.
Add an XYZ overlay for demand predictability (X = steady, Y = variable, Z = sporadic) and you get a matrix that tells you exactly which parts cost the most relative to their contribution. Your CZ parts, low-value with unpredictable demand, are the worst offenders. They sit on shelves for months, tying up space and capital with no reliable return.
Method 2: Demand Forecasting Improvements
Bad forecasting is the root cause of excess inventory. Overestimate demand by 20% and you’re carrying 20% more stock than necessary. At 25% carrying cost, that forecast error costs you 5 cents for every dollar of overstocked inventory, every year.
Most Canadian manufacturers still forecast using historical averages and gut feel. That worked when markets moved slowly. It doesn’t work when a single tariff announcement shifts demand overnight.
Better approaches:
- Statistical forecasting models. Moving averages and exponential smoothing catch trends that spreadsheets miss. Most modern ERP systems include these tools. Few companies actually use them.
- Demand sensing. Combine POS data, customer order patterns, and leading indicators to adjust forecasts in near-real-time instead of waiting for the quarterly review.
- Collaborative planning. Share demand data with key customers. Canadian organizations like the Supply Chain Management Association advocate for integrated planning as a core competency. When your top 10 customers share their production schedules, your forecast accuracy jumps dramatically.
Expected savings: 10-20% reduction in excess inventory, translating to 2.5-5% reduction in total carrying costs. The real win is fewer stockouts combined with lower safety stock. Better forecasts let you carry less while actually improving service levels.
Method 3: Vendor-Managed Inventory (VMI)
VMI shifts inventory ownership and management responsibility to your supplier. The supplier monitors your stock levels, decides when to replenish, and in many arrangements, owns the inventory until you consume it.
For the buyer, the benefits are straightforward. You hold less stock. You spend less time on purchase orders. Your supplier, who knows their production cycles better than you do, manages the timing.
How it works in practice:
- You share real-time inventory data with the supplier (EDI, portal access, or API integration).
- The supplier monitors consumption and triggers replenishment based on agreed min/max levels.
- You pay for inventory when consumed, not when delivered.
Where it works best:
- High-volume consumables from reliable suppliers
- Parts where the supplier has better demand visibility than you do
- Categories where you have strong supplier relationships
Expected savings: 15-25% reduction in carrying costs for VMI-managed categories. The shift in ownership timing alone frees significant working capital.
The catch: VMI requires trust and data sharing. It works best with established, strategic suppliers. Trying to force VMI on a supplier who doesn’t have the systems or interest creates more problems than it solves.
Method 4: Just-in-Time Ordering (Reduce Safety Stock)
Safety stock is insurance. And like all insurance, most companies overbuy it.
The just-in-time (JIT) approach reduces inventory buffers by synchronizing procurement more tightly with actual consumption. Instead of holding 90 days of safety stock “just in case,” you calculate the actual requirement based on demand variability, lead time variability, and your target service level.
The safety stock formula most companies ignore:
Safety Stock = Z-score × Standard Deviation of Lead Time DemandWhere the Z-score reflects your target service level (1.65 for 95%, 2.33 for 99%). The critical input is standard deviation. If your demand is stable and your supplier delivers reliably, you need far less buffer than you think.
Practical steps:
- Measure actual lead time variability. Track supplier delivery performance over 12 months. Most companies use the quoted lead time, not the actual lead time. The gap between the two is where excess safety stock hides.
- Segment safety stock by criticality. Production-critical parts justify higher buffers. Non-critical spares don’t.
- Review quarterly, not annually. Demand patterns shift. Safety stock should shift with them.
Expected savings: 10-25% reduction in total inventory levels. Applied at scale across hundreds of SKUs, this drives real reductions in warehouse space requirements and capital tied up in stock.
The risk is real. Cut too deep and you get stockouts. The key is using data, not fear, to set buffer levels. For parts where even a 2-day delay is unacceptable, keep a physical buffer. For everything else, consider whether on-demand manufacturing can serve as your safety stock instead.
Method 5: Negotiate Consignment Arrangements
Consignment keeps inventory physically at your location but legally owned by the supplier until you use it. You have the parts when you need them. The supplier carries the financial burden until consumption.
This is VMI’s more aggressive cousin. With VMI, the supplier manages replenishment. With consignment, they also own the inventory sitting in your building.
Why suppliers agree to it:
- Guaranteed demand. You’re committing to purchase from them.
- Better visibility into consumption. They plan production more accurately.
- Competitive moat. Consignment inventory makes it harder for you to switch suppliers.
How to negotiate it:
- Start with your largest, most strategic suppliers. Small suppliers rarely have the balance sheet for consignment.
- Offer multi-year volume commitments in exchange for consignment terms.
- Define clear consumption triggers. When does ownership transfer? What happens to slow-moving consignment stock?
- Ensure your ERP tracks consignment inventory separately from owned inventory. This matters for financial reporting.
Expected savings: On consignment-managed categories, carrying costs shift almost entirely to the supplier. For your books, the capital cost component (typically 15-20% of carrying cost) drops to near zero on those SKUs. Storage costs remain since the parts are still in your building, but the financial carrying cost shrinks dramatically.
The limitation: consignment works for standard, replenishable parts from major suppliers. It doesn’t work for custom parts, specialty items, or suppliers who don’t have the financial capacity to carry your inventory on their balance sheet.
Method 6: Liquidate Dead Stock Aggressively
Here’s the uncomfortable truth most warehouses are hiding: 20-30% of inventory in the average manufacturing operation is dead or slow-moving stock that will never generate proportional revenue.
These parts are already a loss. Every month they sit on shelves, the loss compounds. They occupy space that could hold productive inventory. They consume insurance premiums. They require counting and management. And they get harder to sell as time passes.
An aggressive liquidation strategy:
- Define “dead” clearly. No movement in 12 months. Or carrying cost has exceeded 50% of the part’s original value. Pick a threshold and enforce it.
- Liquidation channels. Surplus industrial buyers, online marketplaces (eBay, Amazon Business, Kijiji for Business), industry-specific brokers, scrap and recycling. Get what you can. Something is better than nothing.
- Write it off and move on. The accounting write-off stings. But the ongoing carrying cost of pretending those parts will sell stings more. A one-time hit to the income statement is better than a perpetual drain on working capital.
- Prevent recurrence. Implement automatic flags for inventory aging. When a SKU crosses the 6-month-no-movement threshold, it triggers a review. Don’t wait for the annual physical count to discover problems.
Expected savings: One-time recovery of 10-50 cents on the dollar for liquidated stock, plus permanent elimination of carrying costs on those SKUs. For a company with $500,000 in dead stock, eliminating the 25% annual carrying cost saves $125,000 per year going forward.
This isn’t a strategy. It’s hygiene. Every dollar locked in dead stock is a dollar your competitors are investing in growth.
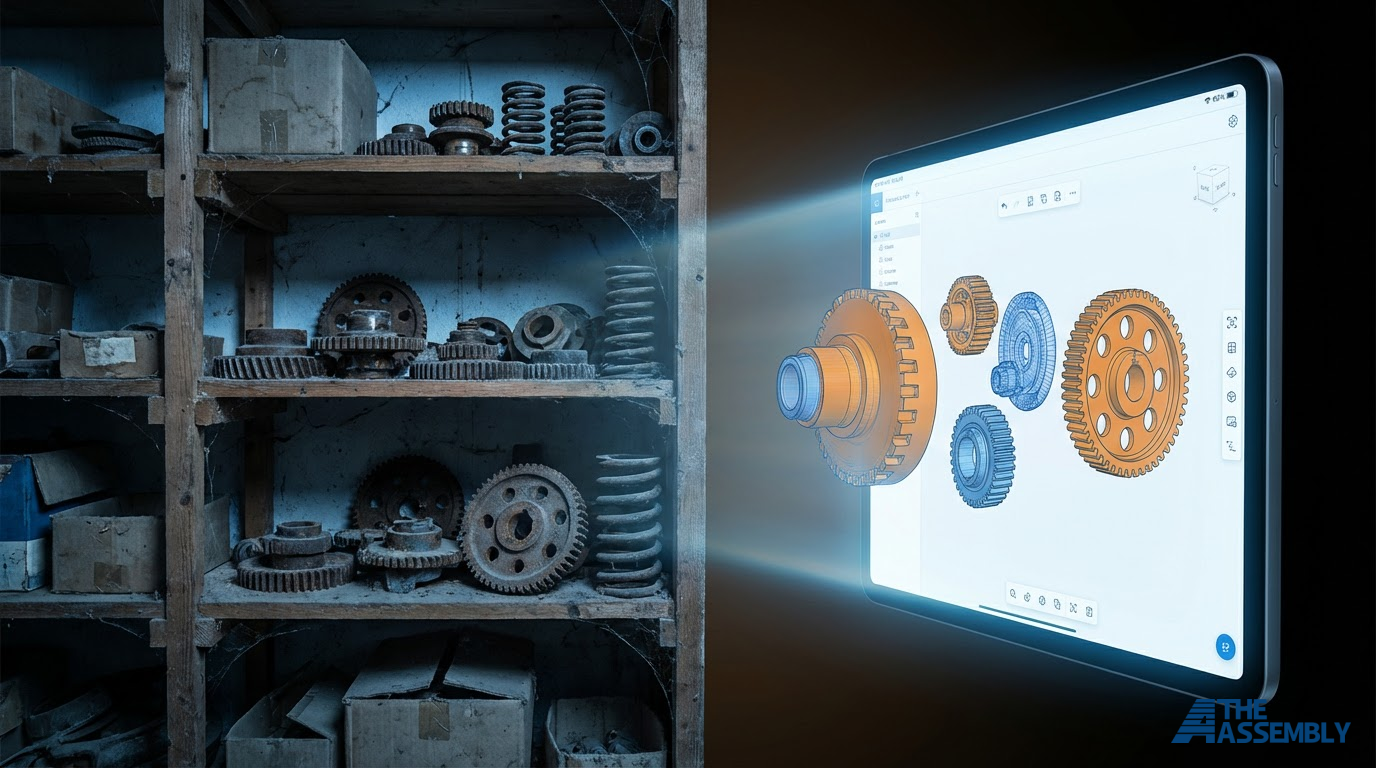
Method 7: Digital Inventory (Eliminate Carrying Costs Entirely)
Methods 1 through 6 optimize your warehouse. Method 7 questions whether you need one.
Digital inventory replaces physical stock with production-ready digital files. Instead of shelves full of parts waiting for orders, you store verified CAD models and manufacturing specifications. When a customer needs a part, it gets manufactured on demand through a network of local production facilities and delivered in as fast as 2 business days.
No warehouse. No safety stock. No obsolescence. No carrying costs.
This isn’t theoretical. Deutsche Bahn, the German national railway, has produced over 200,000 replacement and series parts through on-demand manufacturing across 700+ applications since 2015. They maintain approximately 1,000 virtual models in their digital warehouse, with a target of 10,000 components by 2030. Result: up to 60% cost reduction versus traditional procurement and lead times compressed from 10 months to 2 months.
Daimler Trucks identified approximately 40,000 bus and touring coach spare parts suitable for digital inventory across the Mercedes-Benz and Setra brands. Parts are produced at or near the point of need. No tooling. No warehousing.
Volvo Construction Equipment now produces and delivers spare parts in as little as one week through on-demand manufacturing, with no minimum order quantity. For older equipment where traditional supply chains have dried up, digital inventory made “unobtainable” parts permanently available again.
How the economics work:
The per-unit cost of on-demand production is typically 10-30% higher than bulk manufacturing. That’s real. But compare total cost of ownership, not unit price.
A part sitting in your warehouse for 2 years at 25% carrying cost has accumulated 50% in holding costs on top of its purchase price. The “expensive” on-demand alternative would need to cost 1.5x more just to break even. And that calculation doesn’t include warehouse overhead, insurance, management labor, or the opportunity cost of trapped capital.
For a $3 million inventory, shifting 60% of SKUs to digital inventory eliminates over $400,000 in annual carrying costs while freeing more than $1.8 million in working capital.
What qualifies for digital inventory:
- Parts with annual demand under a few hundred units
- Slow-moving spare parts and aftermarket components
- Legacy parts where original suppliers have stopped production
- Any part that can be manufactured through CNC machining, 3D printing (FDM, SLS, SLA, MJF), laser cutting, or other computer-controlled production methods
Most companies find that 60-80% of their SKUs are candidates. These are the long-tail parts that make up the majority of your part numbers but a minority of actual demand. They sit on shelves for months, sometimes years. They drive disproportionate warehousing costs. And they’re the easiest to digitize because they don’t require bulk pricing economics.
What stays physical:
High-volume commodity parts with stable demand (standard fasteners, common consumables). Production-critical spares where even 2 days is too long. Parts with extreme tolerances requiring dedicated tooling. Keep a small physical buffer for these. Digitize everything else.
The Canadian advantage:
For Canadian manufacturers, digital inventory through a domestic network means parts never cross borders. No tariff exposure. No customs delays. No CUSMA documentation headaches. In a trade environment where 65.5% of Canadian manufacturing businesses report negative tariff impacts, removing cross-border dependency is as much about risk management as cost reduction.
Parts produced locally through a Canadian manufacturing network also qualify under the federal Policy on Prioritizing Canadian Suppliers and Canadian Content for government procurement. Parts imported from overseas do not.
This is the structural shift. Methods 1 through 6 make your warehouse cheaper to operate. Method 7 makes the warehouse optional for the majority of your SKUs.
How to Decide Which Approach Fits Your Parts
Not every method applies to every SKU. Here’s a decision framework for sorting your inventory into the right strategy.
Step 1: Is the part dead stock? No movement in 12 months or carrying cost exceeds original value. If yes, liquidate (Method 6). Stop paying to store parts that won’t sell.
Step 2: Is annual demand above 1,000 units with stable, predictable consumption? If yes, this is a traditional inventory management candidate. Apply ABC analysis (Method 1), tighten forecasting (Method 2), explore VMI (Method 3) or consignment (Method 5) with your supplier. JIT ordering (Method 4) reduces the safety stock buffer.
Step 3: Is annual demand below a few hundred units, sporadic, or unpredictable? If yes, and the part can be manufactured through CNC, 3D printing, or laser cutting, this is a prime candidate for digital inventory (Method 7). These are the parts where carrying costs eat the most value relative to actual consumption.
Step 4: Is the part production-critical with zero tolerance for any lead time? Keep a small physical buffer. But consider digitizing the file anyway as a backup source. When your primary supplier has a disruption, a 2-day on-demand option beats a 12-week reorder from overseas.
The general rule: High-volume, predictable parts stay physical with optimized management. Low-volume, sporadic parts go digital. Everything in between gets evaluated on total cost of ownership, not unit price.
Most companies that run this analysis discover the same thing: the parts costing them the most to carry are the easiest ones to digitize.
Frequently Asked Questions
How much can I realistically save on inventory carrying costs?
Methods 1 through 6 (ABC analysis, better forecasting, VMI, JIT, consignment, liquidation) typically deliver 10-30% reduction in total carrying costs when applied together. Method 7 (digital inventory) eliminates carrying costs entirely on applicable SKUs, which represent 60-80% of part numbers for most manufacturers. For a company with $3 million in inventory and $975,000 in annual carrying costs, a combined strategy reduces that figure by $400,000-$700,000 per year.
Which method should I start with?
Start with ABC analysis (Method 1) and dead stock liquidation (Method 6). ABC analysis costs nothing but time and immediately tells you where to focus. Liquidation generates cash and frees warehouse space. Together, they create the data and the breathing room you need to implement the other methods effectively.
Is digital inventory realistic for small and mid-size manufacturers?
Yes. Digital inventory doesn’t require massive capital investment. You’re replacing physical stock with digital files and paying for production only when orders arrive. The upfront cost is digitization (creating verified CAD files for your parts), which runs $200-$1,000 per part depending on complexity. For a pilot of 10-20 parts, that’s a modest investment against potentially tens of thousands in annual carrying cost savings. Companies like Deutsche Bahn and Daimler operate at scale, but the model works at any size. Learn how to digitize your spare parts inventory step by step.
How do I calculate my actual carrying cost?
Add up four components: capital costs (inventory value multiplied by your cost of capital), storage costs (warehouse rent, utilities, equipment, labor), service costs (insurance, systems, administration), and risk costs (obsolescence write-offs, shrinkage, deterioration). Divide the total by your average inventory value. If you’re below 20%, you’re almost certainly missing costs. Most manufacturers land between 25-35%. Our complete guide to inventory carrying cost walks through the full calculation with examples.
Can methods 1-6 and method 7 work together?
Absolutely. They’re complementary, not competing. Use ABC analysis to identify which SKUs are candidates for which strategy. Apply forecasting, JIT, VMI, and consignment to your high-volume A items. Liquidate dead stock. Digitize your long-tail B and C items. The result is a hybrid inventory model: lean physical stock for high-volume parts, zero physical stock for everything else. That’s the lowest total cost structure available.
The Bottom Line
You have two choices with inventory carrying costs.
Choice one: optimize around the edges. Tighten safety stock. Improve forecasts. Negotiate better terms with suppliers. These are good moves. They’ll save you 10-30%.
Choice two: question the fundamental assumption that parts need to sit on shelves waiting for orders. For 60-80% of your SKUs, they don’t. Digital files are lighter than boxes. On-demand production is cheaper than warehousing. And capital deployed for growth beats capital locked in storage every time.
The smartest companies will do both. Optimize what needs to stay physical. Digitize everything that doesn’t.
Your inventory is costing you more than you think. Now you know seven ways to fix it. One of them changes the math entirely.
Next Steps
- Calculate Your Savings — Run your actual inventory numbers and see what each method saves you
- Understand Digital Inventory — Deep dive into Method 7 and how it works
- Know Your Real Carrying Cost — Calculate the number most companies get wrong
- Talk to Our Team — Get a personalized assessment of which methods fit your parts profile