Every dollar of inventory on your shelves costs you 25 cents a year. Not to buy it. Not to ship it. Just to let it sit there.
That’s the number most manufacturers never calculate. They negotiate purchase prices down to the penny, then park $3 million in parts on warehouse shelves and forget about the slow bleed draining a quarter of that value every single year.
$3 million in inventory. $750,000 in carrying costs. Every year, whether those parts sell or not.
Canadian manufacturers are sitting on billions in excess inventory right now. The companies that understand this math will outcompete those that don’t. It’s that simple.
What Are Inventory Carrying Costs?
Inventory carrying costs (also called holding costs) are the total annual expense of storing unsold inventory. This includes the opportunity cost of tied-up capital, warehouse expenses, insurance, and losses from obsolescence and shrinkage. For most manufacturers, carrying costs run 20-30% of total inventory value per year.
That percentage starts ticking the moment parts arrive at your dock. It doesn’t stop until they ship to a customer. For slow-moving spares, that clock runs for years. For obsolete stock, it runs until you take the write-off.
The problem is visibility. Carrying costs don’t appear as a single line item on your income statement. They’re buried across rent, insurance, depreciation, labor, and a dozen other accounts. Nobody at your company sees the total. Which is exactly why it compounds unchecked.
The 4 Components of Carrying Cost
Most companies track one or two of these. Almost none track all four.
1. Capital Costs (15% of inventory value)
This is the largest piece. It’s the money locked in inventory that could be doing something else.
When you buy $3 million in parts and put them on shelves, that’s $3 million that can’t fund equipment upgrades, new product development, market expansion, or debt reduction. The cost of that trapped capital is your weighted average cost of capital (WACC), or the interest rate on the loan that financed the purchase.
With the Bank of Canada’s policy rate having moved through significant swings since 2022, capital costs have been volatile and elevated. At a 10-15% cost of capital, a $3 million inventory position costs $300,000 to $450,000 annually in capital costs alone.
That’s before you pay for a single square foot of warehouse space.
2. Storage Costs (2-5% of inventory value)
These are the costs most companies actually track. Warehouse rent. Utilities. Racking and shelving. Material handling equipment. Warehouse labor. WMS software.
Canadian industrial rents averaged $15.11 per square foot at the end of 2024, according to CBRE. New warehouse construction runs $77 to $139 per square foot depending on size and region. Even if you own your building, the space has a cost. Utilities, maintenance, property tax, and the opportunity cost of using that square footage for something productive.
For a mid-size manufacturer carrying $3 million in parts inventory, storage costs typically run $60,000 to $150,000 per year.
3. Service Costs (1-3% of inventory value)
The administrative overhead of managing and protecting what you’ve stored.
Insurance premiums on inventory. Inventory management software licenses. Cycle counting labor. Physical inventory audits. Security systems. Administrative overhead for procurement, receiving, and put-away.
These costs scale with complexity. More SKUs, more warehouse locations, more regulatory requirements. Each one adds overhead that compounds quietly.
For that same $3 million inventory, service costs typically run $30,000 to $90,000 per year.
4. Risk Costs (3-10% of inventory value)
The most variable component. And the one most companies dramatically underestimate.
Obsolescence. Parts become outdated. Engineering changes make them incompatible. Customer specifications evolve. The average Canadian manufacturer carries 20-30% of its inventory as dead or obsolete stock. That’s not a rounding error. That’s $600,000 to $900,000 in parts that will eventually be written off on a $3 million inventory.
Shrinkage. Theft, damage, miscounts, administrative errors. Industry benchmarks put shrinkage at 1-2% annually.
Deterioration. Materials degrade. Rubber hardens. Lubricants expire. Plastics become brittle. Metal corrodes. Even parts that remain technically current can become physically unusable.
Price decline. Market values drop below your purchase price. Technology advances make older specifications worth less. You paid $50 per unit. The market now pays $30. The $20 difference is a carrying cost you’ll never recover.
For high-tech or fast-changing industries, risk costs alone can exceed 10% of inventory value annually.
The Carrying Cost Formula
Here’s the calculation every operations leader and CFO should run at least once a year.
The Formula
Carrying Cost (%) = Total Annual Carrying Costs / Average Inventory Value x 100Worked Example: $3M Inventory
A mid-size Canadian manufacturer with $3 million in average inventory value.
| Component | Calculation | Annual Cost |
|---|---|---|
| Capital costs | $3,000,000 x 12% WACC | $360,000 |
| Storage costs | Warehouse rent, utilities, equipment, labor | $90,000 |
| Service costs | Insurance, software, admin, counting | $50,000 |
| Risk costs | Obsolescence ($300K) + shrinkage ($30K) + deterioration ($45K) + price decline ($100K) | $475,000 |
| Total carrying cost | $975,000 | |
| Carrying cost percentage | $975,000 / $3,000,000 | 32.5% |
That manufacturer is spending $975,000 every year just to hold $3 million in parts. Not to buy them. Not to move them. Just to let them sit.
And they have $3 million in working capital doing nothing on shelves.
Why Most Manufacturers Underestimate Carrying Costs
Research consistently shows manufacturers underestimate their actual carrying costs by 40-60%. Three factors drive this.
The invisible opportunity cost
Capital trapped in inventory doesn’t appear as an expense on your income statement. It’s the single largest component of carrying cost, often 15% of inventory value, and it’s completely invisible in standard accounting. Your CFO sees inventory as a current asset on the balance sheet. They don’t see the $360,000 in opportunity cost that asset generates every year.
Deferred obsolescence recognition
Nobody wants to admit parts are obsolete. The engineering team says they might need them. The sales team says a customer might order. So the parts sit for another year. Then another.
The economic loss happened the day those parts became unlikely to sell. But the accounting recognition gets deferred until someone forces a write-off. By then, you’ve paid two or three more years of carrying costs on parts worth zero.
Dennis Darby, President and CEO of Canadian Manufacturers & Exporters, has noted that more than 90% of Canadian manufacturers are small businesses. For these companies, underestimating inventory costs is especially damaging. Their capital constraints are already tight. Every dollar locked in dead stock is a dollar that can’t fund growth.
Sunk cost psychology
“We’ve already paid for it” is the most expensive sentence in manufacturing.
Once inventory is purchased, there’s a deep psychological resistance to recognizing its ongoing cost. The purchase feels like a one-time event. The carrying cost is a continuous drain that doesn’t trigger the same alarm bells. So parts accumulate. Shelves fill. And the 25% annual tax keeps compounding in silence.
The Real Impact on Canadian Manufacturers
Carrying costs don’t exist in a vacuum. They ripple through every part of your business.
Direct profit destruction
Every dollar of carrying cost comes straight off your bottom line. For a company operating at 5% net margins, that $975,000 in carrying costs requires $19.5 million in additional revenue just to break even. Read that again. $19.5 million in sales to cover the cost of inventory sitting on shelves.
Capital starvation
$3 million in working capital locked on warehouse shelves is $3 million that can’t fund:
- Equipment upgrades that improve throughput
- New product development that opens markets
- Hiring that addresses capacity constraints
- Debt reduction that lowers interest expense
- Acquisitions that accelerate growth
This is the definition of dead capital. Money that exists on your balance sheet but does nothing for your business.
The tariff multiplier
Here’s where it gets worse for Canadian manufacturers specifically.
65.5% of Canadian manufacturing businesses reported negative impacts from US tariffs in 2025, according to Statistics Canada. The Canadian Federation of Independent Business found that nearly 1 in 5 small businesses dealing with tariff costs won’t survive more than 6 months if conditions persist.
Tariff uncertainty makes carrying costs even more dangerous. Parts imported before a tariff change may suddenly be worth less than you paid. Components stockpiled as a hedge against future tariffs tie up even more capital. Cross-border inventory becomes a liability the moment trade policy shifts.
Every dollar locked in speculative inventory is a dollar exposed to policy risk you can’t control.
Competitive disadvantage
Your competitor with lower carrying costs can price more aggressively. They can invest more in innovation. They can weather downturns without layoffs. They have cash for acquisitions you can’t afford.
If they’ve figured out carrying costs and you haven’t, you’re already losing. You just don’t see it on your income statement yet.
How to Calculate YOUR Carrying Costs
Stop using industry averages. Calculate your real number. Here’s how.
Step 1: Calculate your average inventory value
Pull monthly inventory values for the past 12 months. Add them up. Divide by 12.
Average Inventory Value = Sum of 12 Monthly Ending Inventory Values / 12Don’t use a single point-in-time snapshot. Inventory fluctuates. Monthly averages give you the true picture.
Step 2: Calculate capital costs
Determine your company’s weighted average cost of capital (WACC). If you don’t know it, ask your CFO. If you don’t have a CFO, use your borrowing rate plus 2-3%.
Capital Cost = Average Inventory Value x WACCFor a company borrowing at 7% with a 5% equity premium, WACC is approximately 12%. On $3 million inventory: $360,000 per year.
Step 3: Sum your storage costs
Add up everything related to physically housing inventory:
- Warehouse rent or allocated building cost
- Utilities (heat, power, lighting for storage areas)
- Racking, shelving, and storage equipment depreciation
- Forklifts and material handling equipment
- Warehouse labor (including benefits)
- Warehouse management system costs
Step 4: Sum your service costs
- Property insurance on inventory
- Inventory management software
- Cycle counting and physical inventory labor
- Security systems and monitoring
- Administrative overhead (purchasing, receiving, put-away)
Step 5: Calculate risk costs
This is where most companies cheat. Don’t.
Pull your last three years of inventory write-offs. Average them. That’s your obsolescence cost. Add shrinkage (if you don’t track it, use 1.5% of inventory value). Add any deterioration losses. Add any price-decline write-downs.
Risk Cost = 3-Year Average Write-offs + Shrinkage + Deterioration + Price DeclinesStep 6: Add it all up
Total Carrying Cost = Capital + Storage + Service + Risk
Carrying Cost % = Total Carrying Cost / Average Inventory Value x 100
If your number comes in below 20%, you’re missing costs. Go back to Step 5 and be honest about obsolescence.
If your number exceeds 30%, you have significant opportunity to improve. Keep reading.
Use our ROI calculator to run these numbers and model different scenarios for your specific inventory profile.
3 Strategies to Reduce Carrying Costs
Strategy 1: Rationalize your inventory ruthlessly
The fastest path to lower carrying costs is holding less inventory. Start with an ABC/XYZ analysis.
ABC ranks parts by value (A = top 20% of parts driving 80% of spend, B = middle, C = bottom). XYZ ranks by demand predictability (X = steady, Y = variable, Z = sporadic).
Your targets are the BZ and CZ parts. Moderate-to-low value, unpredictable demand. These parts sit on shelves for months. They consume warehouse space out of proportion to revenue. And most companies have hundreds or thousands of them.
Challenge every safety stock assumption. Most safety stock levels were set by someone years ago using gut feel, not math. Recalculate based on actual service level requirements and real lead time data. You’ll find most safety stock can drop 30-50% without any impact on fill rates.
Kill dead SKUs aggressively. If a part hasn’t moved in 18 months and there’s no firm order in the pipeline, it’s dead. Write it off. Free the shelf space. Stop paying to insure it.
Strategy 2: Shorten your supply chain
Carrying costs are a function of two variables: how much inventory you hold and how long you hold it. Shorter lead times reduce both.
Source from Canadian and North American suppliers instead of overseas. A 4-week lead time from a supplier in Ontario means you need far less safety stock than a 14-week lead time from a supplier in Shenzhen. And you eliminate the tariff exposure, customs delays, and transit risk that come with cross-border supply chains.
Regional sourcing also means smaller, more frequent orders. Instead of buying 500 units to justify the ocean freight, buy 50 units and reorder in two weeks. Less inventory. Lower carrying costs. Less obsolescence risk.
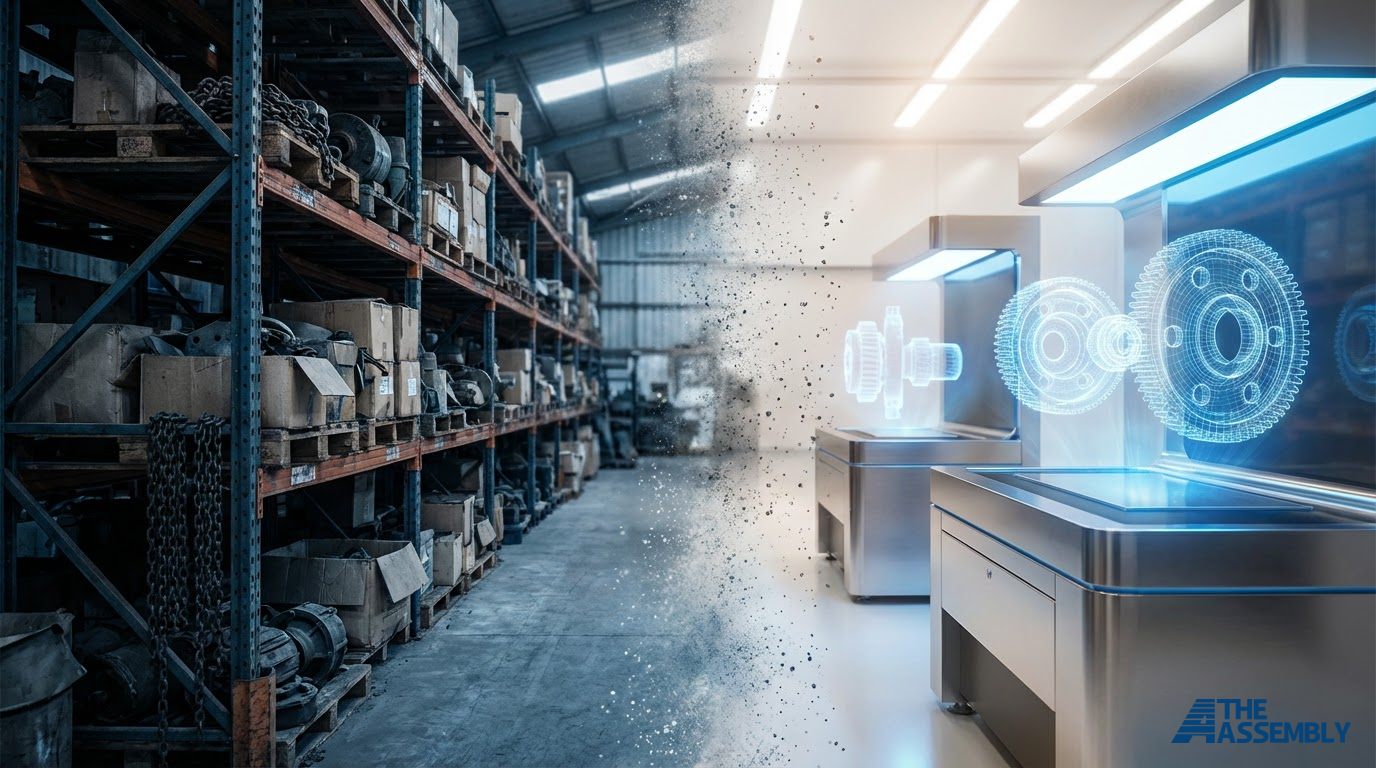
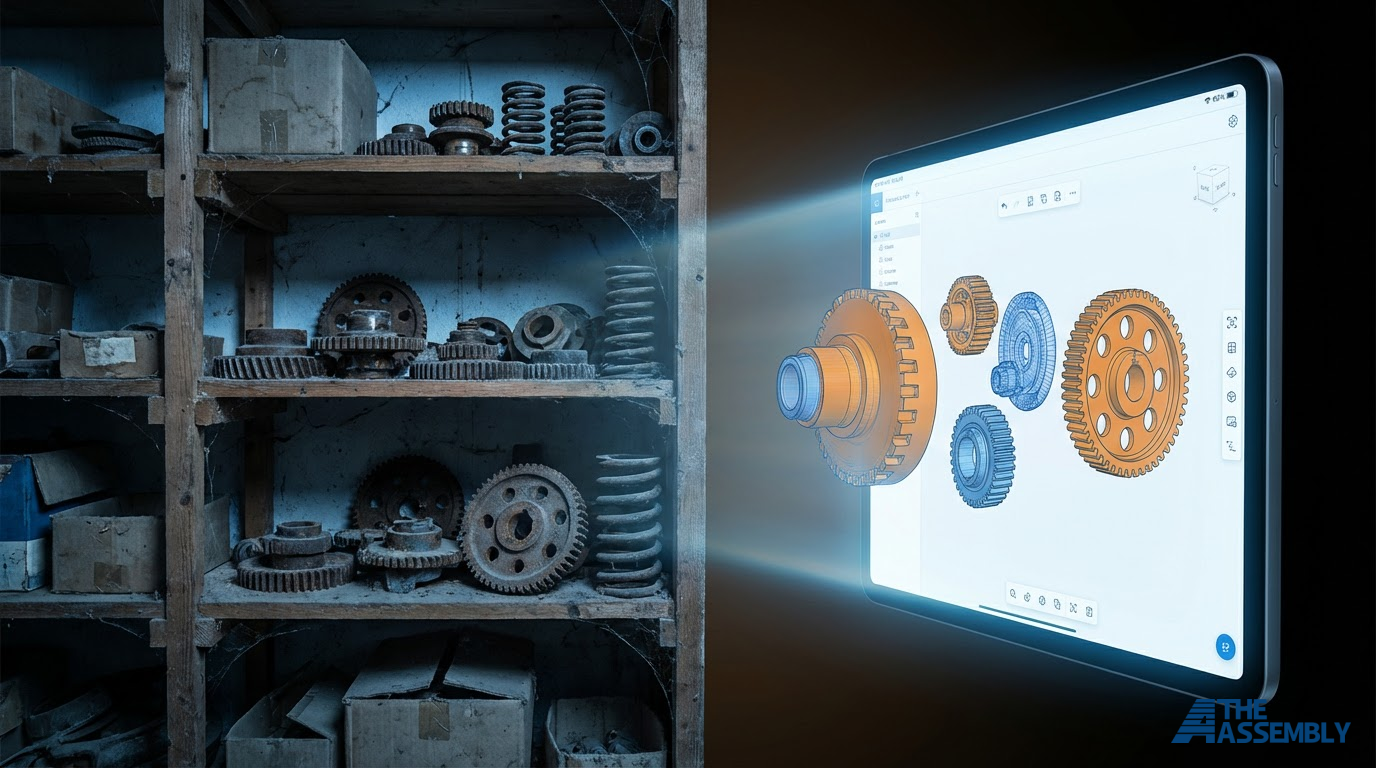
Strategy 3: Eliminate carrying costs entirely with digital inventory
The first two strategies reduce carrying costs. This one eliminates them.
Digital inventory replaces physical warehouses with digital files. Instead of storing 500 replacement gaskets on a shelf, you store a verified CAD file. When a customer needs a gasket, it gets manufactured and delivered within 2 business days through a local production facility. You store nothing. You carry nothing. You pay only when someone orders.
This is not theoretical. Deutsche Bahn, the German national railway, has produced over 200,000 replacement parts through on-demand manufacturing across 700+ applications. They maintain approximately 1,000 virtual models in their digital warehouse with a target of 10,000 by 2030. The result: up to 60% cost reduction versus conventional spare parts procurement.
For Canadian manufacturers, digital inventory through a domestic production network offers an additional advantage: parts manufactured locally don’t cross borders. No tariff exposure. No customs delays. No exchange rate risk. Full compliance with the federal government’s Buy Canadian procurement policy.
Here’s what the shift looks like for that $3 million inventory example:
| Physical Inventory | Digital Inventory | |
|---|---|---|
| Inventory on shelves | $3,000,000 | $0 |
| Annual carrying cost | $975,000 | $0 |
| Warehouse space required | 2,000+ sq ft | 0 sq ft |
| Obsolescence risk | 20-30% of inventory | None |
| Working capital freed | $0 | Up to $3,000,000 |
| Per-unit production cost | Lower (bulk) | 10-30% higher (on-demand) |
| Total cost of ownership | Higher | Lower for 60-80% of SKUs |
The per-unit cost of on-demand production is higher than bulk. That’s true. But when you add carrying costs, obsolescence write-offs, warehouse overhead, and trapped working capital, total cost of ownership is lower for any part with low-to-moderate, unpredictable demand.
That describes 60-80% of SKUs in a typical manufacturer’s inventory. The long-tail parts. The slow movers. The ones costing you a fortune to store and generating almost no revenue.
High-volume, predictable parts stay in traditional procurement. Everything else moves to digital. Your warehouse shrinks. Your working capital gets freed. Your carrying costs drop toward zero.
FAQ
What is a good carrying cost percentage?
Industry benchmarks put average carrying costs at 20-30% of inventory value annually. But “good” depends on your industry. Electronics and high-tech manufacturers often see 30-40% due to rapid obsolescence. Industrial equipment manufacturers typically run 22-28%. If your calculated carrying cost is below 20%, you’re almost certainly missing cost components. Most companies that do a thorough calculation land between 25-35%.
How do interest rates affect inventory carrying costs?
Interest rates directly impact the capital cost component, which is the single largest piece of carrying cost at 10-15% of inventory value. When rates rise, the opportunity cost of capital trapped in inventory increases proportionally. A 2-percentage-point increase in your cost of capital on $3 million in inventory adds $60,000 per year in carrying costs. This is why elevated interest rate environments make inventory reduction strategies more urgent.
What is the difference between carrying costs and holding costs?
They’re the same thing. “Carrying costs” and “holding costs” are used interchangeably. Both refer to the total annual expense of storing unsold inventory, including capital costs, storage costs, service costs, and risk costs. Some textbooks prefer one term over the other, but the calculation and the components are identical.
How much dead stock does the average manufacturer carry?
Studies consistently show that 20-30% of a typical manufacturer’s inventory is dead or obsolete. For a company carrying $3 million in inventory, that’s $600,000 to $900,000 in parts that will eventually be written off. The carrying costs on that dead stock compound every year it sits unrecognized. Aggressive SKU rationalization and regular obsolescence reviews are the first line of defense.
Can you eliminate carrying costs completely?
For your entire inventory, no. High-volume, fast-moving parts are still most cost-effective to buy in bulk and warehouse. But for the 60-80% of SKUs with low, sporadic, or unpredictable demand, digital inventory through on-demand manufacturing can reduce carrying costs to near zero. You store a digital file instead of physical parts. Production happens only when a customer orders. No warehouse. No insurance. No obsolescence. No carrying cost.
How often should you calculate carrying costs?
At minimum, annually. Quarterly is better, especially in volatile environments where interest rates, real estate costs, or obsolescence rates are shifting. The companies that treat carrying cost as a KPI reviewed alongside revenue and margin tend to maintain lower inventory levels and higher returns on working capital. Build it into your operations review cadence.
Your Inventory Is Taxing Your Business at 25% Per Year
That’s the number. Every year, a quarter of your inventory value disappears into capital costs, warehouse overhead, insurance, and obsolescence. No invoice arrives. No alarm goes off. It just compounds in silence while your balance sheet makes it look like an asset.
The math is clear. The question is what you do with it.
Start with the numbers. Use our ROI calculator to calculate your actual carrying costs and model what shifting to digital inventory would save your operation.
Then talk to someone who’s done this. Book a 15-minute call with our team. Bring your inventory data. We’ll tell you which parts are candidates for digital inventory, what the production cost looks like, and whether the math works for your specific operation. No pitch. Just numbers.
Your warehouse is costing you more than you think. The manufacturers who figure that out first will win.