Most comparisons between digital and traditional inventory get it wrong. They compare unit costs.
A 3D-printed bracket costs $47. The injection-molded version costs $12. Case closed, traditional wins. Article over.
Except that comparison ignores 80% of what you actually pay. It ignores the $15/sq ft warehouse holding parts you ordered 18 months ago. It ignores the insurance on stock that might never ship. It ignores the $600,000 in dead inventory you’ll eventually write off. And it completely ignores the millions in working capital pinned to shelves instead of funding growth.
Unit price is one line item. Total cost of ownership is the whole story. And the whole story looks very different.
Digital Inventory vs. Traditional Warehousing: Quick Comparison
| Factor | Traditional Warehousing | Digital Inventory |
|---|---|---|
| What you store | Finished physical parts on shelves | CAD files and production specs in the cloud |
| Unit cost | Lower per part (bulk pricing) | 10-30% higher per part (on-demand production) |
| Annual carrying cost | 25-35% of inventory value | Near zero |
| Storage cost | $15+/sq ft warehouse space | ~$200/month for secure digital storage |
| Minimum order quantity | 500-10,000 units typical | 1 unit |
| Lead time | 6-12 weeks (overseas), 2-4 weeks (domestic bulk) | As fast as 2 days |
| Obsolescence risk | High. 20-30% of stock becomes dead inventory | None. Files don’t expire |
| Working capital required | Major (purchase + store + insure full stock) | Minimal (pay per part, when needed) |
| Design update process | Scrap existing stock, reorder | Update the CAD file |
| Geographic reach | Ship from central warehouse | Produce near point of need |
This table tells you what the differences are. The rest of this article tells you what they cost.
How Traditional Warehousing Actually Costs You
Everyone knows the sticker price of warehouse inventory. Purchase price times quantity. That’s the number on the PO.
But the real cost? It’s the accumulation of expenses that start the moment those parts hit your shelf and don’t stop until you ship them or write them off. Most operations leaders underestimate this by 40-60%.
The visible costs
These are the ones your accounting team tracks:
- Warehouse rent. Canadian industrial rents averaged $15.11/sq ft at end of 2024. If you’re storing $3M in parts, you’re looking at 2,000-5,000 sq ft of dedicated space.
- Warehouse labor. Someone has to receive, shelve, pick, pack, and count that inventory. Even a half-FTE warehouse role costs $30,000+/year.
- Insurance. You’re insuring the building and the inventory inside it. Premiums scale with value.
- Inventory management systems. Software licenses, barcode systems, cycle counting. The infrastructure of tracking physical stuff.
The invisible costs
These are the ones that don’t appear on a single line item. They’re distributed across your income statement, hidden in plain sight.
- Capital cost. Every dollar locked in inventory is a dollar not earning returns, not funding growth, not reducing debt. At a 10-12% cost of capital, $3M in inventory costs you $300,000-$360,000 per year in opportunity cost alone. That number doesn’t appear on any invoice.
- Obsolescence. Parts become outdated. Specifications change. Equipment gets retired. The average manufacturer carries 20-30% dead or obsolete stock. On $3M in inventory, that’s $600,000-$900,000 in value that will eventually be written off. Companies delay these write-offs for years, pretending the stock will eventually sell. It won’t.
- Depreciation and deterioration. Rubber degrades. Plastics yellow. Metals corrode. Even in climate-controlled storage, materials have shelf lives. Parts that were perfect when purchased become non-conforming over time.
- MOQ overstocking. Your supplier requires a minimum order of 500 units. You need 12. Now you’re storing 488 units you won’t use for years, if ever. The per-unit price looked great. The total cost of buying and holding 40x what you needed? Not so much.
Add it all up, and you’re paying 25-35% of your inventory’s value every single year just to keep it on shelves. That’s not a storage fee. That’s a tax on dead capital.
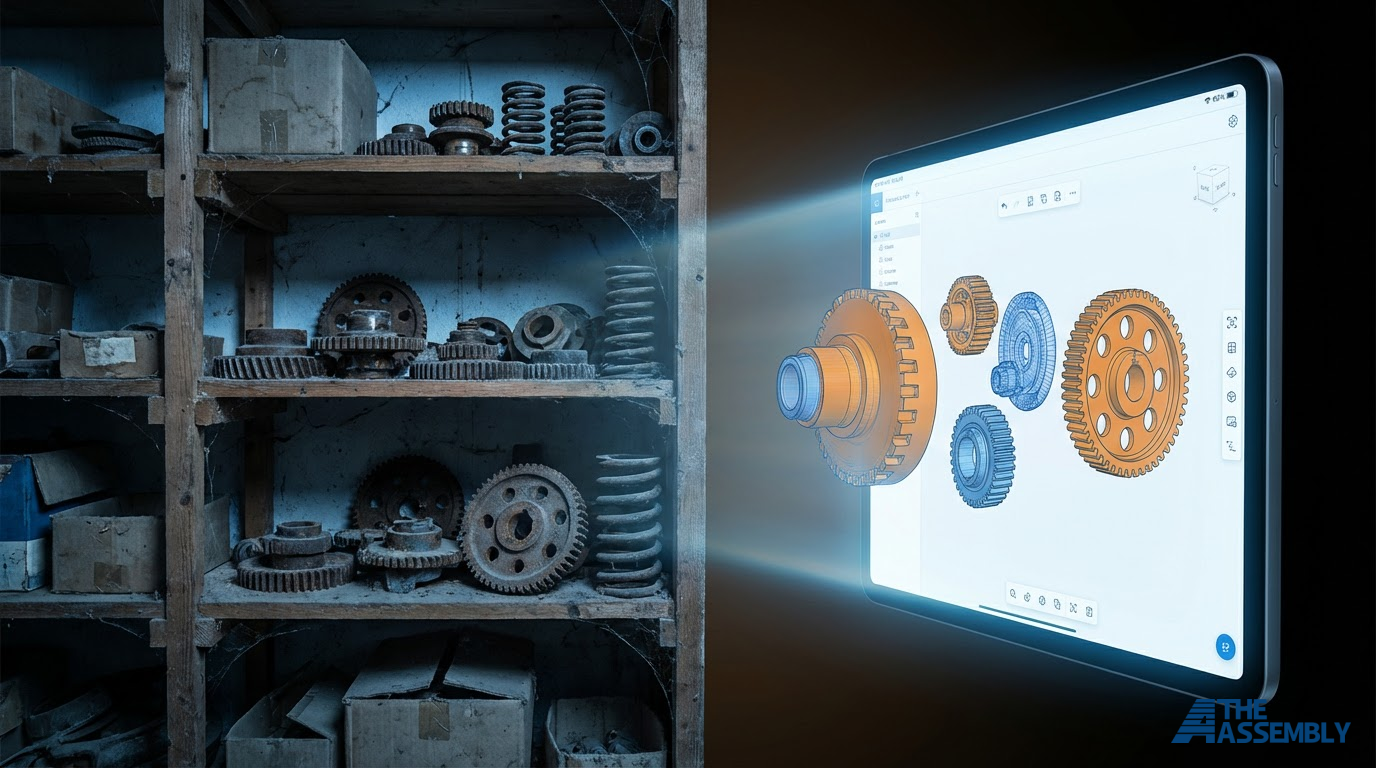
How Digital Inventory Works
Digital inventory replaces the warehouse with a file. Instead of shelves full of parts, you maintain a library of verified CAD models and production specifications. When a part is needed, it’s manufactured on demand through a network of local producers and delivered in as fast as 2 days.
The short version: you keep the design. We make the part. Only when you need it.
For a detailed breakdown of the full process, from inventory audit through digitization, qualification, and on-demand production, read our complete digital inventory guide.
What matters for this comparison is what digital inventory eliminates:
- No warehouse space required
- No carrying costs accumulating
- No minimum order quantities
- No obsolescence write-offs
- No working capital trapped on shelves
- No insurance on physical stock you might never ship
The trade-off is a higher per-unit production cost. On-demand manufacturing typically runs 10-30% more per part than bulk production. That’s the number most comparisons fixate on. And that’s exactly where the analysis falls apart.
The Real Math: Side-by-Side Total Cost Comparison
Let’s stop comparing unit prices and start comparing what you actually pay. We’ll use a scenario that maps to a real mid-size Canadian manufacturer: $3M in spare parts inventory across roughly 2,000 SKUs.
Scenario: $3M spare parts inventory
Traditional warehousing. Annual cost of ownership.
| Cost Category | Calculation | Annual Cost |
|---|---|---|
| Capital cost (opportunity cost at 10%) | $3,000,000 x 10% | $300,000 |
| Warehouse rent (3,000 sq ft) | 3,000 x $15/sq ft | $45,000 |
| Warehouse labor (0.5 FTE) | $30,000 | |
| Insurance on inventory | ~0.5% of value | $15,000 |
| Inventory management systems | $12,000 | |
| Annual obsolescence write-offs (5%) | $3,000,000 x 5% | $150,000 |
| Depreciation and shrinkage (2%) | $3,000,000 x 2% | $60,000 |
| Utilities, maintenance, misc. | $13,000 | |
| Total annual cost | $625,000 |
And the carrying cost percentage based on the larger formula (including the full capital cost component at industry standard 25% of inventory value):
| Summary metric | Value |
|---|---|
| Total carrying cost (25% of $3M) | $750,000 |
| Plus warehouse overhead | $100,000 |
| Plus annual write-offs | $150,000 |
| Total annual cost of holding | $975,000 |
Plus: $3,000,000 in working capital locked on shelves.
Now the digital side.
Digital inventory. Annual cost of ownership.
| Cost Category | Calculation | Annual Cost |
|---|---|---|
| Secure digital file storage | ~$200/month | $2,400 |
| On-demand production premium | 10-30% higher per unit vs. bulk | Varies by demand |
| Total annual fixed cost | $2,400 |
Working capital freed: up to $3,000,000.
Where the per-unit premium actually lands
Here’s where the math gets interesting. Critics of digital inventory point to the 10-30% per-unit premium and stop there. But let’s trace that through.
Assume your $3M inventory turns over slowly. That’s typical for spare parts. Maybe $600,000 in actual annual demand across all SKUs.
At a 20% average on-demand premium, that’s an extra $120,000/year in production costs.
Compare that to $975,000/year in carrying and holding costs.
Net annual savings: $855,000. Even at a 30% premium on every single part, the savings are $795,000.
And that’s before counting the $3M in working capital you’ve freed up. At a 10% return on redeployed capital, that’s another $300,000 in annual value.
The per-unit cost is higher. The total cost of ownership is dramatically lower. The gap isn’t even close.
Where Digital Inventory Wins
Not every part is an equal candidate. Digital inventory has clear advantages in specific scenarios that cover the majority of most manufacturers’ SKU counts.
Low-demand SKUs
This is the biggest win. The parts you order 5, 10, 50 times a year. The ones that sit on shelves for months between orders. These parts carry disproportionate holding costs relative to their revenue. They’re the first 60-80% of your SKU list and probably account for less than 20% of your actual demand volume.
For these parts, the on-demand premium is trivial compared to what you’re paying to warehouse them.
Unpredictable demand
Parts with sporadic or seasonal ordering patterns are impossible to stock efficiently. Order too many and you’re sitting on dead capital. Order too few and you stock out. Digital inventory eliminates this forecasting problem entirely. You produce what’s ordered. Nothing more.
Aging equipment and legacy parts
Here’s where digital inventory solves a problem traditional warehousing can’t. When equipment ages out, original suppliers stop manufacturing replacement parts. Tooling gets scrapped. You’re left with a choice: hoard whatever remaining stock you can find, or go without.
Digital inventory makes legacy parts permanently available. The file doesn’t care if the original supplier went bankrupt in 2019. As long as the design exists, the part can be produced.
Long-tail aftermarket parts
Automotive, heavy equipment, aerospace. Any industry that supports fleets over 20-30 year lifecycles faces the long-tail problem. You can’t justify warehousing parts for a 2008 model year indefinitely. But you can store the file indefinitely at near-zero cost.
Custom and low-MOQ parts
Traditional manufacturing forces minimum orders. Need 3 custom brackets? Your supplier wants you to order 500. Digital inventory has no MOQ. Order 1. Order 3. Order 17. Pay for exactly what you need.
Parts crossing borders
In today’s tariff environment, any part that crosses a border is a cost and timeline risk. 65.5% of Canadian manufacturers reported negative tariff impacts in 2025. Parts manufactured locally through a digital inventory network don’t cross borders. No tariffs. No customs delays. No trade policy volatility.
Where Traditional Warehousing Still Makes Sense
Digital inventory isn’t a universal replacement. Saying otherwise would be dishonest. Traditional warehousing still wins in specific, well-defined scenarios.
High-volume, stable-demand commodity parts
Standard fasteners. Common O-rings. Washers. Bolts. If you use 50,000 units per year with predictable weekly demand, bulk purchasing and warehousing is cheaper. The carrying cost per unit is low because these parts turn over fast. The MOQ aligns with actual consumption. The per-unit savings of bulk production are real and meaningful at this volume.
Parts requiring dedicated tooling
Some parts are only economically viable through processes that require custom tooling: injection molding, die casting, stamping. If the tooling already exists and the volumes justify it, traditional production and warehousing makes sense. Once you’ve paid for the tool, the marginal unit cost is very low.
Time-critical safety stock
There are situations where even 2 days is too long. Emergency medical equipment. Critical infrastructure components. In-field military applications. For these, a small physical buffer stock is warranted. But “small” is the key word. Keep safety stock for the 5-10% of parts where downtime cost is catastrophic. Digitize the other 90%.
Highly regulated parts with extensive certification
Some aerospace and medical components require batch-level traceability and certification processes that are purpose-built around traditional manufacturing workflows. These can be digitized, but the qualification effort is higher. Start with simpler parts and build toward these over time.
The Hybrid Model: The 80/20 Approach
The smartest approach isn’t all-or-nothing. It’s a hybrid.
Keep physical inventory for the 20% of SKUs that are high-volume, fast-turning, and predictable. These are your A-class parts with X-class demand patterns. Bulk purchasing works. Warehousing makes sense. The carrying cost per unit is manageable because they don’t sit long.
Digitize the other 80% of SKUs. These are your B, C, and Z-class parts. Low volume. Sporadic demand. Long shelf times. High carrying cost relative to value. They’re eating your warehouse space, tying up your capital, and a significant portion will eventually be written off as obsolete.
What the 80/20 shift looks like in practice
| Metric | Before (100% Physical) | After (80/20 Hybrid) |
|---|---|---|
| SKUs in physical warehouse | 2,000 | 400 |
| Physical inventory value | $3,000,000 | $900,000 |
| Annual carrying costs | $975,000 | $292,500 |
| Warehouse space needed | 3,000 sq ft | 800 sq ft |
| Annual obsolescence write-offs | $150,000 | $30,000 |
| Working capital freed | $0 | $2,100,000 |
| On-demand production premium | $0 | ~$72,000 |
| Net annual savings | Baseline | $730,500 |
That $730,500 is real money. Not a projection. Not a “potential savings.” It’s the mathematical difference between storing 2,000 SKUs and storing 400, with the rest produced on demand at a per-unit premium that’s a fraction of the carrying cost it replaces.
Who’s Already Doing This: Three Case Studies
This isn’t theory. The largest industrial companies in the world are already operating digital inventories at scale.
Deutsche Bahn: 200,000+ parts, 60% cost reduction
Germany’s national railway operator maintains one of the most complex spare parts challenges in industrial manufacturing. Thousands of train models across decades of service. Original equipment manufacturers that no longer exist. Parts that are literally unobtainable through traditional procurement.
Deutsche Bahn has produced over 200,000 replacement and series parts through on-demand manufacturing since 2015. They maintain approximately 1,000 virtual models in their digital warehouse, with a target of 10,000 components by 2030.
The results:
- 60% cost reduction versus conventional manufacturing procurement
- Lead times dropped from 10 months to 2 months
- Parts that were previously unobtainable are now permanently available
- Design updates happen through CAD revisions, not retooling projects
For a railway operator supporting rolling stock over 30-40 year lifecycles, digital inventory solved the fundamental problem: how do you keep parts available for equipment that outlives its suppliers?
Daimler Trucks: 40,000 parts identified for digital inventory
Daimler identified approximately 40,000 bus and touring coach spare parts suitable for digital inventory across the Mercedes-Benz and Setra brands.
These aren’t prototypes or novelty items. They’re production spare parts manufactured on demand at or near the point of need. No physical tooling. No inventory storage. No minimum orders.
40,000 SKUs removed from physical warehousing. Multiply that by per-SKU carrying costs and the savings are measured in tens of millions annually.
Volvo Construction Equipment: 1-week delivery, no MOQ
Volvo CE now produces and delivers spare parts through on-demand manufacturing in as little as one week, with no minimum order quantity.
This is particularly valuable for older construction equipment where traditional manufacturing is no longer cost-effective. A customer with a 15-year-old excavator needing a replacement housing doesn’t need to source a discontinued part from a dwindling supply. The digital file exists. The part gets made.
No MOQ means Volvo doesn’t need to guess demand. They don’t need to warehouse stock “just in case.” They produce exactly what’s ordered, when it’s ordered.
The pattern
All three share a common thread: large fleets, long lifecycles, thousands of low-demand SKUs. That’s the profile where digital inventory delivers the most dramatic cost reduction. And that profile describes a significant share of Canadian manufacturers, from mining equipment operators in Northern Ontario to marine fleet operators in Atlantic Canada.
Frequently Asked Questions
Is on-demand production quality as good as traditional manufacturing?
Yes. On-demand parts are produced using the same manufacturing methods as traditional production. CNC machining, multi-axis milling, industrial 3D printing (SLS, MJF), laser cutting. The equipment is the same. The materials are the same. The difference is batch size and production trigger (order-driven vs. forecast-driven), not quality. Every part goes through dimensional verification and first article inspection before becoming part of your digital inventory.
How long does it take to transition from physical to digital inventory?
Most companies can digitize their first 10-20 parts within 4-6 weeks, including CAD file creation, production method selection, and first article qualification. Scaling to hundreds of parts typically takes 6-12 months. The approach is progressive: start with your highest carrying-cost, lowest-demand parts and expand from there. You don’t need to convert everything at once.
What if I need a part urgently and can’t wait for on-demand production?
On-demand production through a distributed network delivers in as fast as 2 business days for most parts. That’s faster than many traditional supply chains, especially for parts sourced overseas. For the small number of truly critical parts where any wait is unacceptable, maintain a minimal physical safety stock. This is typically 5-10% of SKUs, not 100%.
Does digital inventory work for metal parts, or only plastics?
It works for both. CNC machining produces metal parts (aluminum, steel, stainless, titanium, brass) to the same tolerances as any traditional machine shop. Multi-axis CNC handles complex geometries. 3D printing in metals (DMLS, SLM) is available for specialized applications. The “digital inventory is only 3D printing” misconception comes from early coverage that focused exclusively on additive manufacturing. The reality is much broader.
How do I calculate the break-even point for my specific inventory?
Start with your current annual carrying cost (inventory value times 25% is a reasonable starting estimate). Add obsolescence write-offs, warehouse overhead, and insurance. That’s your baseline cost. Then estimate the on-demand premium for your actual annual demand volume (typically 10-30% over bulk pricing). The break-even is where the per-unit premium equals the carrying cost savings. For most spare parts inventories, digital inventory breaks even at surprisingly low demand volumes. Use our Digital Inventory Savings Calculator to run your specific numbers.
The Bottom Line
The unit cost comparison between digital and traditional inventory is a trap. It looks at one number in isolation and ignores the system of costs surrounding it.
When you compare total cost of ownership, the math is unambiguous:
- $975,000/year to hold $3M in physical inventory
- $2,400/year in digital storage plus an on-demand production premium that, even at its highest, is a fraction of carrying costs
- $3,000,000 in working capital freed for growth
The per-unit cost is higher. The total cost is dramatically lower. The working capital impact alone changes the financial profile of your operation.
You don’t need to make an all-or-nothing decision. Start with the 80% of SKUs burning a hole in your warehouse. Keep the 20% that justify bulk production. Run the numbers on your own inventory.
The math will do the persuading.
Ready to see what your inventory is really costing you?
Run the numbers. Use our Digital Inventory Savings Calculator to model your current carrying costs against an on-demand alternative. Takes 5 minutes. No login required.
See which parts qualify. Explore how digital inventory works for your specific operation.
Talk to us. Book a 15-minute call with our team. Bring your SKU list. We’ll tell you which parts are candidates, what production costs look like, and whether the math works for your operation. No pitch. Just numbers.